Get in touch


BIKE MONITOR
The CITY CYCLING data portal for municipalities

Using data to understand cycling patterns and plan according to demand.
Where do large numbers of cyclists abound? Where are the waiting times especially long and which cycle paths tend to be avoided? With the BIKE MONITOR data portal, you can use data to identify where your local cycling network is already working well and where action is needed.
How are the data sourced?
BIKE MONITOR uses the rides participating cyclists record using the CITY CYCLING app, which are scientifically evaluated in collaboration with the Dresden University of Technology (TU Dresden). The resulting clearly visualised cycling data enables sound planning and targeted improvement of the local cycling infrastructure.
The data used by BIKE MONITOR is updated annually after the end of the CITY CYCLING campaign season and, for the time being, is only available to German CITY CYCLING municipalities.
Access to critical information
BIKE MONITOR’s versatile map layers allow you to comprehensively analyse cycling traffic in your municipality, providing:
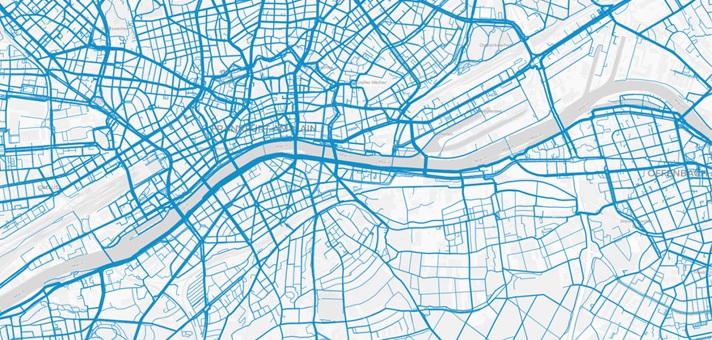
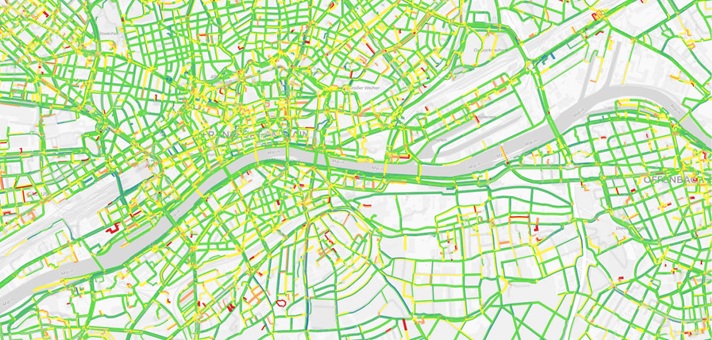
- Traffic volumes and cycling speeds
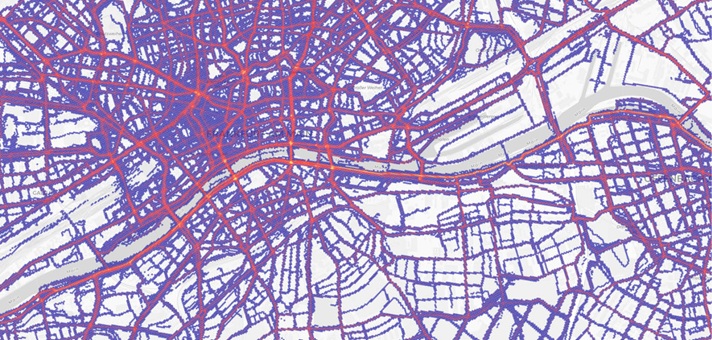
- Heat maps
- Source and destination traffic
- Waiting times
- RADar! reports and accident data
Users can also access a separate statistics section and further layers are currently in development.
Have questions about the BIKE MONITOR?
 Contact us